
Top 200 Gross Earnings Films
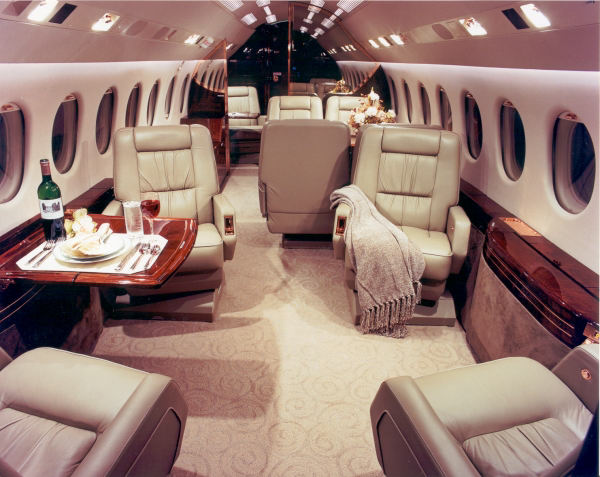
When Standard Is Not The Norm... VIP's Access Strive For The Exquisite
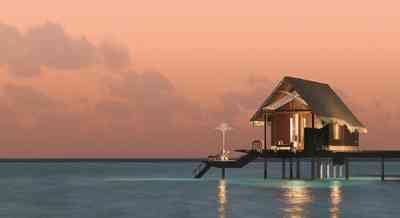
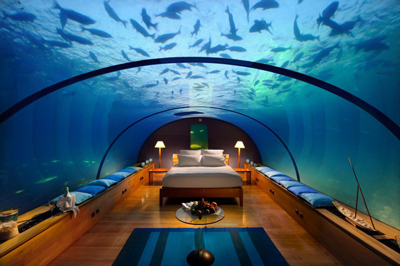
Explore the most luxurious hotels in the world for a perfect Getaway!
Whether planning a Business, Leisure or Romantic travel we can assist
All Time Box Office Earnings
It is worth mentioning at the exception of few instances, the highly lucrative movies are the following: —Super Heroes —Actions Adventures and —Animations. Therefore, if pursuing investment into filmmaking, those are the categories to focus on. Although the production cost could be higher for those categories, returns on investment however, could be astronomical with a great project.
—Explore films investment strategies with VIP's Access, visit the link below;Films Investment Strategies
Top 100 Films Earnings
| Rank | Title | Studio | Worldwide | Domestic / % | Overseas / % | Year^ | ||
| 1 | Avatar | Fox | $2,788 Bil | $760.5 | 27.3% | $2,027.5 | 72.7% | 2009^ |
| 2 | Titanic | Par. | $2,187 B | $659.4 | 30.1% | $1,528.1 | 69.9% | 1997^ |
| 3 | Star Wars: The Force Awakens | BV | $2,068 B | $936.7 | 45.3% | $1,131.6 | 54.7% | 2015 |
| 4 | Avengers: Infinity War | BV | $2,046 B | $678.8 | 33.2% | $1,367.8 | 66.8% | 2018 |
| 5 | Jurassic World | Uni. | $1,671 B | $652.3 | 39.0% | $1,019.4 | 61.0% | 2015 |
| 6 | Marvel's The Avengers | BV | $1,518 B | $623.4 | 41.0% | $895.5 | 59.0% | 2012 |
| 7 | Furious 7 | Uni. | $1,516 B | $353.0 | 23.3% | $1,163.0 | 76.7% | 2015 |
| 8 | Avengers: Age of Ultron | BV | $1,405 B | $459.0 | 32.7% | $946.4 | 67.3% | 2015 |
| 9 | Black Panther | BV | $1,346 B | $700.1 | 52.0% | $646.9 | 48.0% | 2018 |
| 10 | Harry Potter and the Deathly Hallows Part 2 | WB | $1,341 B | $381.0 | 28.4% | $960.5 | 71.6% | 2011 |
| 11 | Star Wars: The Last Jedi | BV | $1,332 B | $620.2 | 46.5% | $712.4 | 53.5% | 2017 |
| 12 | Jurassic World: Fallen Kingdom | Uni. | $1,304 B | $416.8 | 31.9% | $888.1 | 68.1% | 2018 |
| 13 | Frozen | BV | $1,276 B | $400.7 | 31.4% | $875.7 | 68.6% | 2013 |
| 14 | Beauty and the Beast | BV | $1,263 B | $504.0 | 39.9% | $759.5 | 60.1% | 2017 |
| 15 | The Fate of the Furious | Uni. | $1,236 B | $226.0 | 18.3% | $1,010.0 | 81.7% | 2017 |
| 16 | Incredibles 2 | BV | $1,227 B | $607.5 | 49.5% | $619.9 | 50.5% | 2018 |
| 17 | Iron Man 3 | BV | $1,214 B | $409.0 | 33.7% | $805.8 | 66.3% | 2013 |
| 18 | Minions | Uni. | $1,159 B | $336.0 | 29.0% | $823.4 | 71.0% | 2015 |
| 19 | Captain America: Civil War /td> | BV | $1,153 B | $408.1 | 35.4% | $745.2 | 64.6% | 2016 |
| 20 | Transformers: Dark of the Moon | P/DW | $1,123 B | $352.4 | 31.4% | $771.4 | 68.6% | 2011 |
| 21 | The Lord of the Rings: The Return of the King | NL | $1,119 B | $377.8 | 33.7% | $742.1 | 66.3% | 2003^ |
| 22 | Skyfall | Sony | $1,108 B | $304.4 | 27.5% | $804.2 | 72.5% | 2012 |
| 23 | Transformers: Age of Extinction | Par. | $1,104 B | $245.4 | 22.2% | $858.6 | 77.8% | 2014 |
| 24 | The Dark Knight Rises | WB | $1,084 B | $448.1 | 41.3% | $636.8 | 58.7% | 2012 |
| 25 | Toy Story 3 | BV | $1,067 B | $415.0 | 38.9% | $652.0 | 61.1% | 2010 |
| 26 | Pirates of the Caribbean: Dead Man's Chest | BV | $1,066 B | $423.3 | 39.7% | $642.9 | 60.3% | 2006 |
| 27 | Rogue One: A Star Wars Story | BV | $1,056 B | $532.2 | 50.4% | $523.9 | 49.6% | 2016 |
| 28 | Pirates of the Caribbean: On Stranger Tides | BV | $1,045 B | $241.1 | 23.1% | $804.6 | 76.9% | 2011 |
| 29 | Despicable Me 3 | Uni. | $1,034 B | $264.6 | 25.6% | $770.2 | 74.4% | 2017 |
| 30 | Jurassic Park | Uni. | $1,029 B | $402.5 | 39.1% | $626.7 | 60.9% | 1993^ |
| 31 | Finding Dory | BV | $1,028 B | $486.3 | 47.3% | $542.3 | 52.7% | 2016 |
| 32 | Star Wars: Episode I - The Phantom Menace | Fox | $1,027 B | $474.5 | 46.2% | $552.5 | 53.8% | 1999^ |
| 33 | Alice in Wonderland (2010) | BV | $1,025 B | $334.2 | 32.6% | $691.3 | 67.4% | 2010 |
| 34 | Zootopia | BV | $1,023 B | $341.3 | 33.3% | $682.5 | 66.7% | 2016 |
| 35 | The Hobbit: An Unexpected Journey | WB (NL) | $1,021 B | $303.0 | 29.7% | $718.1 | 70.3% | 2012 |
| 36 | The Dark Knight | WB | $1,004 B | $534.9 | 53.2% | $469.7 | 46.8% | 2008^ |
| 37 | Harry Potter and the Sorcerer's Stone | WB | $974.8 Mil | $317.6 | 32.6% | $657.2 | 67.4% | 2001 |
| 38 | Despicable Me 2 | Uni. | $970.8 | $368.1 | 37.9% | $602.7 | 62.1% | 2013 |
| 39 | The Lion King | BV | $968.5 | $422.8 | 43.7% | $545.7 | 56.3% | 1994^ |
| 40 | The Jungle Book (2016) | BV | $966.6 | $364.0 | 37.7% | $602.5 | 62.3% | 2016 |
| 41 | Pirates of the Caribbean: At World's End | BV | $963.4 | $309.4 | 32.1% | $654.0 | 67.9% | 2007 |
| 42 | Jumanji: Welcome to the Jungle | Sony | $962.1 | $404.5 | 42.0% | $557.6 | 58.0% | 2017 |
| 43 | Harry Potter and the Deathly Hallows Part 1 | WB | $960.3 | $296.0 | 30.8% | $664.3 | 69.2% | 2010 |
| 44 | The Hobbit: The Desolation of Smaug | WB (NL) | $958.4 | $258.4 | 27.0% | $700.0 | 73.0% | 2013 |
| 45 | The Hobbit: The Battle of the Five Armies | WB (NL) | $956.0 | $255.1 | 26.7% | $700.9 | 73.3% | 2014 |
| 46 | Finding Nemo | BV | $940.3 | $380.8 | 40.5% | $559.5 | 59.5% | 2003^ |
| 47 | Harry Potter and the Order of the Phoenix | WB | $939.9 | $292.0 | 31.1% | $647.9 | 68.9% | 2007 |
| 48 | Harry Potter and the Half-Blood Prince | WB | $934.4 | $302.0 | 32.3% | $632.5 | 67.7% | 2009 |
| 49 | The Lord of the Rings: The Two Towers | NL | $926.0 | $342.6 | 37.0% | $583.5 | 63.0% | 2002^ |
| 50 | Shrek 2 | DW | $919.8 | $441.2 | 48.0% | $478.6 | 52.0% | 2004 |
| 51 | Harry Potter and the Goblet of Fire | WB | $896.9 | $290.0 | 32.3% | $606.9 | 67.7% | 2005 |
| 52 | Spider-Man 3 | Sony | $890.9 | $336.5 | 37.8% | $554.3 | 62.2% | 2007 |
| 53 | Ice Age: Dawn of the Dinosaurs | Fox | $886.7 | $196.6 | 22.2% | $690.1 | 77.8% | 2009 |
| 54 | Spectre | Sony | $880.7 | $200.1 | 22.7% | $680.6 | 77.3% | 2015 |
| 55 | Spider-Man: Homecoming | Sony | $880.2 | $334.2 | 38.0% | $546.0 | 62.0% | 2017 |
| 56 | Harry Potter and the Chamber of Secrets | WB | $879.0 | $262.0 | 29.8% | $617.0 | 70.2% | 2002 |
| 57 | Ice Age: Continental Drift | Fox | $877.2 | $161.3 | 18.4% | $715.9 | 81.6% | 2012 |
| 58 | The Secret Life of Pets | Uni. | $875.5 | $368.4 | 42.1% | $507.1 | 57.9% | 2016 |
| 59 | Batman v Superman: Dawn of Justice | WB | $873.6 | $330.4 | 37.8% | $543.3 | 62.2% | 2016 |
| 60 | The Lord of the Rings: The Fellowship of the Ring | NL | $871.5 | $315.5 | 36.2% | $556.0 | 63.8% | 2001^ |
| 61 | Wolf Warrior 2 | HC | $870.3 | $2.7 | 0.3% | $867.6 | 99.7% | 2017 |
| 62 | The Hunger Games: Catching Fire | LGF | $865.0 | $424.7 | 49.1% | $440.3 | 50.9% | 2013 |
| 63 | Guardians of the Galaxy Vol. 2 | BV | $863.8 | $389.8 | 45.1% | $473.9 | 54.9% | 2017 |
| 64 | Inside Out | BV | $857.6 | $356.5 | 41.6% | $501.1 | 58.4% | 2015 |
| 65 | Thor: Ragnarok | BV | $854.0 | $315.1 | 36.9% | $538.9 | 63.1% | 2017 |
| 66 | Star Wars: Episode III - Revenge of the Sith | Fox | $848.8 | $380.3 | 44.8% | $468.5 | 55.2% | 2005^ |
| 67 | Transformers: Revenge of the Fallen | P/DW | $836.3 | $402.1 | 48.1% | $434.2 | 51.9% | 2009 |
| 68 | The Twilight Saga: Breaking Dawn Part 2 | LG/S | $829.7 | $292.3 | 35.2% | $537.4 | 64.8% | 2012 |
| 69 | Inception | WB | $828.3 | $292.6 | 35.3% | $535.7 | 64.7% | 2010 |
| 70 | Wonder Woman | WB | $821.8 | $412.6 | 50.2% | $409.3 | 49.8% | 2017 |
| 71 | Spider-Man | Sony | $821.7 | $403.7 | 49.1% | $418.0 | 50.9% | 2002 |
| 72 | Independence Day | Fox | $817.4 | $306.2 | 37.5% | $511.2 | 62.5% | 1996^ |
| 73 | Fantastic Beasts and Where To Find Them | WB | $814.0 | $234.0 | 28.8% | $580.0 | 71.2% | 2016 |
| 74 | Coco | BV | $807.1 | $209.7 | 26.0% | $597.4 | 74.0% | 2017 |
| 75 | Shrek the Third | P/DW | $799.0 | $322.7 | 40.4% | $476.2 | 59.6% | 2007 |
| 76 | Harry Potter and the Prisoner of Azkaban | WB | $796.7 | $249.5 | 31.3% | $547.1 | 68.7% | 2004 |
| 77 | Pirates of the Caribbean: Dead Men Tell No Tales | BV | $794.9 | $172.6 | 21.7% | $622.3 | 78.3% | 2017 |
| 78 | E.T.: The Extra-Terrestrial | Uni. | $792.9 | $435.1 | 54.9% | $357.8 | 45.1% | 1982^ |
| 79 | Mission: Impossible - Fallout | Par. | $791.1 | $220.2 | 27.8% | $570.9 | 72.2% | 2018 |
| 80 | Fast & Furious 6 | Uni. | $788.7 | $238.7 | 30.3% | $550.0 | 69.7% | 2013 |
| 81 | Indiana Jones and the Kingdom of the Crystal Skull | Par. | $786.6 | $317.1 | 40.3% | $469.5 | 59.7% | 2008 |
| 82 | Spider-Man 2 | Sony | $783.8 | $373.6 | 47.7% | $410.2 | 52.3% | 2004 |
| 83 | Deadpool | Fox | $783.1 | $363.1 | 46.4% | $420.0 | 53.6% | 2016 |
| 84 | Star Wars | Fox | $775.4 | $461.0 | 59.5% | $314.4 | 40.5% | 1977^ |
| 85 | Guardians of the Galaxy | BV | $773.3 | $333.2 | 43.1% | $440.2 | 56.9% | 2014 |
| 86 | 2012 | Sony | $769.7 | $166.1 | 21.6% | $603.6 | 78.4% | 2009 |
| 87 | Maleficent | BV | $758.5 | $241.4 | 31.8% | $517.1 | 68.2% | 2014 |
| 88 | The Da Vinci Code | Sony | $758.2 | $217.5 | 28.7% | $540.7 | 71.3% | 2006 |
| 89 | The Amazing Spider-Man | Sony | $757.9 | $262.0 | 34.6% | $495.9 | 65.4% | 2012 |
| 90 | The Hunger Games: Mockingjay - Part 1 | LGF | $755.4 | $337.1 | 44.6% | $418.2 | 55.4% | 2014 |
| 91 | Shrek Forever After | P/DW | $752.6 | $238.7 | 31.7% | $513.9 | 68.3% | 2010 |
| 92 | X-Men: Days of Future Past | Fox | $747.9 | $233.9 | 31.3% | $513.9 | 68.7% | 2014 |
| 93 | Madagascar 3: Europe's Most Wanted | P/DW | $746.9 | $216.4 | 29.0% | $530.5 | 71.0% | 2012 |
| 94 | Suicide Squad | WB | $746.8 | $325.1 | 43.5% | $421.7 | 56.5% | 2016 |
| 95 | The Chronicles of Narnia: The Lion, the Witch and the Wardrobe | BV | $745.0 | $291.7 | 39.2% | $453.3 | 60.8% | 2005 |
| 96 | Monsters University | BV | $744.2 | $268.5 | 36.1% | $475.7 | 63.9% | 2013 |
| 97 | The Matrix Reloaded | WB | $742.1 | $281.6 | 37.9% | $460.6 | 62.1% | 2003 |
| 98 | Up | BV | $735.1 | $293.0 | 39.9% | $442.1 | 60.1% | 2009 |
| 99 | Deadpool 2 | Fox | $734.2 | $318.5 | 43.4% | $415.8 | 56.6% | 2018 |
| 100 | Gravity | WB | $723.2 | $274.1 | 37.9% | $449.1 | 62.1% | 2013 |
Top 100 Animated Earnings
| Rank | Released | Movie | Worldwide Box Office |
Domestic Box Office |
International Box Office |
|---|---|---|---|---|---|
| 1 | 2013 | Frozen | $1,272,469,910 | $400,738,009 | $871,731,901 |
| 2 | 2018 | Incredibles 2 | $1,227,539,569 | $607,539,569 | $620,000,000 |
| 3 | 2015 | Minions | $1,162,781,621 | $336,045,770 | $826,735,851 |
| 4 | 2010 | Toy Story 3 | $1,069,666,004 | $415,004,880 | $654,661,124 |
| 5 | 2017 | Despicable Me 3 | $1,034,520,868 | $264,624,300 | $769,896,568 |
| 6 | 2016 | Finding Dory | $1,021,350,883 | $486,295,561 | $535,055,322 |
| 7 | 2016 | Zootopia | $1,019,706,594 | $341,268,248 | $678,438,346 |
| 8 | 1994 | The Lion King | $986,332,275 | $421,785,283 | $564,546,992 |
| 9 | 2013 | Despicable Me 2 | $975,216,835 | $368,065,385 | $607,151,450 |
| 10 | 2004 | Shrek 2 | $937,008,132 | $441,226,247 | $495,781,885 |
| 11 | 2003 | Finding Nemo | $936,429,370 | $380,529,370 | $555,900,000 |
| 12 | 2016 | The Secret Life of Pets | $886,767,422 | $368,384,330 | $518,383,092 |
| 13 | 2012 | Ice Age: Continental Drift | $879,765,137 | $161,321,843 | $718,443,294 |
| 14 | 2009 | Ice Age: Dawn of the Dinosaurs | $859,701,857 | $196,573,705 | $663,128,152 |
| 15 | 2015 | Inside Out | $856,712,469 | $356,461,711 | $500,250,758 |
| 16 | 2007 | Shrek the Third | $807,330,936 | $322,719,944 | $484,610,992 |
| 17 | 2017 | Coco | $800,095,617 | $209,726,015 | $590,369,602 |
| 18 | 2010 | Shrek Forever After | $756,244,673 | $238,736,787 | $517,507,886 |
| 19 | 2012 | Madagascar 3: Europe's Most Wanted | $746,921,271 | $216,391,482 | $530,529,789 |
| 20 | 2013 | Monsters University | $743,588,329 | $268,488,329 | $475,100,000 |
| 21 | 2009 | Up | $731,463,377 | $293,004,164 | $438,459,213 |
| 22 | 2011 | Kung Fu Panda 2 | $664,837,547 | $165,249,063 | $499,588,484 |
| 23 | 2014 | Big Hero 6 | $652,127,828 | $222,527,828 | $429,600,000 |
| 24 | 2006 | Ice Age: The Meltdown | $651,899,282 | $195,330,621 | $456,568,661 |
| 25 | 2016 | Moana | $637,958,276 | $248,757,044 | $389,201,232 |
| 26 | 2016 | Sing | $634,547,945 | $270,329,045 | $364,218,900 |
| 27 | 2008 | Kung Fu Panda | $631,910,531 | $215,434,591 | $416,475,940 |
| 28 | 2007 | Ratatouille | $626,549,695 | $206,445,654 | $420,104,041 |
| 29 | 2004 | The Incredibles | $614,726,752 | $261,441,092 | $353,285,660 |
| 30 | 2014 | How to Train Your Dragon 2 | $614,586,270 | $177,002,924 | $437,583,346 |
| 31 | 1991 | Beauty and the Beast | $608,431,132 | $376,057,266 | $232,373,866 |
| 32 | 2008 | Madagascar: Escape 2 Africa | $599,680,774 | $180,174,880 | $419,505,894 |
| 33 | 2010 | Tangled | $586,477,240 | $200,821,936 | $385,655,304 |
| 34 | 2013 | The Croods | $573,068,425 | $187,168,425 | $385,900,000 |
| 35 | 2011 | Cars 2 | $560,155,383 | $191,450,875 | $368,704,508 |
| 36 | 2001 | Monsters, Inc. | $559,757,719 | $289,423,425 | $270,334,294 |
| 37 | 2005 | Madagascar | $556,559,566 | $193,595,521 | $362,964,045 |
| 38 | 2011 | Puss in Boots | $554,987,477 | $149,260,504 | $405,726,973 |
| 39 | 2012 | Brave | $554,606,532 | $237,282,182 | $317,324,350 |
| 40 | 2010 | Despicable Me | $543,464,573 | $251,513,985 | $291,950,588 |
| 41 | 2008 | WALL-E | $532,508,025 | $223,808,164 | $308,699,861 |
| 42 | 2007 | The Simpsons Movie | $527,071,022 | $183,135,014 | $343,936,008 |
| 43 | 2016 | Kung Fu Panda 3 | $518,418,751 | $143,528,619 | $374,890,132 |
| 44 | 2018 | Hotel Transylvania 3: Summer Vacation | $517,052,922 | $167,031,784 | $350,021,138 |
| 45 | 1999 | Toy Story 2 | $511,358,276 | $245,852,179 | $265,506,097 |
| 46 | 2017 | The Boss Baby | $510,888,357 | $175,003,033 | $335,885,324 |
| 47 | 1992 | Aladdin | $504,050,219 | $217,350,219 | $286,700,000 |
| 48 | 2012 | Wreck-It Ralph | $496,511,521 | $189,412,677 | $307,098,844 |
| 49 | 2010 | How to Train Your Dragon | $494,870,992 | $217,581,232 | $277,289,760 |
| 50 | 2014 | Rio 2 | $492,846,291 | $131,538,435 | $361,307,856 |
| 51 | 2001 | Shrek | $491,812,794 | $267,655,011 | $224,157,783 |
| 52 | 2011 | Rio | $487,519,809 | $143,619,809 | $343,900,000 |
| 53 | 2015 | Hotel Transylvania 2 | $469,500,298 | $169,700,110 | $299,800,188 |
| 54 | 2006 | Cars | $461,651,246 | $244,082,982 | $217,568,264 |
| 55 | 2014 | The Lego Movie | $457,729,388 | $257,784,718 | $199,944,670 |
| 56 | 1999 | Tarzan | $448,191,819 | $171,091,819 | $277,100,000 |
| 57 | 2016 | Ice Age: Collision Course | $403,092,412 | $64,063,008 | $339,029,404 |
| 58 | 2002 | Ice Age | $386,116,343 | $176,387,405 | $209,728,938 |
| 59 | 2015 | Home | $386,031,994 | $177,397,510 | $208,634,484 |
| 60 | 2006 | Happy Feet | $385,000,317 | $198,000,317 | $187,000,000 |
| 61 | 2017 | Cars 3 | $383,549,151 | $152,901,115 | $230,648,036 |
| 62 | 2009 | Monsters vs. Aliens | $381,687,380 | $198,351,526 | $183,335,854 |
| 63 | 2012 | Hotel Transylvania | $378,505,812 | $148,313,048 | $230,192,764 |
| 64 | 2011 | The Adventures of Tintin | $373,993,951 | $77,591,831 | $296,402,120 |
| 65 | 2004 | Shark Tale | $371,917,043 | $161,412,000 | $210,505,043 |
| 66 | 2014 | Penguins of Madagascar | $367,650,911 | $83,350,911 | $284,300,000 |
| 67 | 1995 | Toy Story | $364,545,516 | $191,796,233 | $172,749,283 |
| 68 | 1998 | A Bug's Life | $363,095,319 | $162,798,565 | $200,296,754 |
| 69 | 2000 | Dinosaur | $356,148,063 | $137,748,063 | $218,400,000 |
| 70 | 2016 | The Angry Birds Movie | $352,829,528 | $107,509,366 | $245,320,162 |
| 71 | 2012 | Doctor Seuss' The Lorax | $350,976,753 | $214,030,500 | $136,946,253 |
| 72 | 2017 | Kimi no na wa | $347,179,514 | $5,000,181 | $342,179,333 |
| 73 | 1995 | Pocahontas | $347,100,000 | $141,579,773 | $205,520,227 |
| 74 | 2016 | Trolls | $344,527,425 | $153,707,064 | $190,820,361 |
| 75 | 2006 | Over the Hedge | $343,397,247 | $155,019,340 | $188,377,907 |
| 76 | 2015 | The Good Dinosaur | $333,771,037 | $123,087,120 | $210,683,917 |
| 77 | 2008 | Bolt | $328,015,029 | $114,053,579 | $213,961,450 |
| 78 | 1996 | The Hunchback of Notre Dame | $325,500,000 | $100,138,851 | $225,361,149 |
| 79 | 2010 | Megamind | $321,887,208 | $148,415,853 | $173,471,355 |
| 80 | 2009 | Disney’s A Christmas Carol | $315,709,697 | $137,855,863 | $177,853,834 |
| 81 | 2017 | The Lego Batman Movie | $310,692,896 | $175,750,384 | $134,942,512 |
| 82 | 2004 | The Polar Express | $310,634,169 | $186,493,587 | $124,140,582 |
| 83 | 2005 | Chicken Little | $310,043,823 | $135,386,665 | $174,657,158 |
| 84 | 2012 | Rise of the Guardians | $306,900,902 | $103,412,758 | $203,488,144 |
| 85 | 1998 | Mulan | $303,500,000 | $120,620,254 | $182,879,746 |
| 86 | 2008 | Horton Hears a Who | $299,477,886 | $154,529,439 | $144,948,447 |
| 87 | 2017 | Ferdinand | $289,867,087 | $84,410,380 | $205,456,707 |
| 88 | 2007 | Bee Movie | $287,594,577 | $126,631,277 | $160,963,300 |
| 89 | 2013 | Turbo | $286,896,578 | $83,028,130 | $203,868,448 |
| 90 | 2002 | Sen to Chihiro no Kamikakushi | $274,949,886 | $10,049,886 | $264,900,000 |
| 91 | 2013 | Cloudy with a Chance of Meatballs 2 | $274,392,649 | $119,793,567 | $154,599,082 |
| 92 | 2009 | The Princess and the Frog | $270,997,378 | $104,400,899 | $166,596,479 |
| 93 | 2014 | Mr. Peabody & Sherman | $269,806,430 | $111,506,430 | $158,300,000 |
| 94 | 1942 | Bambi | $268,000,000 | $102,797,000 | $165,203,000 |
| 95 | 1950 | Cinderella | $263,591,415 | $85,000,000 | $178,591,415 |
| 96 | 2013 | Epic | $262,794,441 | $107,518,682 | $155,275,759 |
| 97 | 2005 | Robots | $260,700,012 | $128,200,012 | $132,500,000 |
| 98 | 1997 | Hercules | $250,700,000 | $99,112,101 | $151,587,899 |
| 99 | 2003 | Brother Bear > | $250,397,798 | $85,336,277 | $165,061,521 |
| 100 | 2015 | The Peanuts Movie | $250,091,610 | $130,178,411 | $119,913,199 |
Major Sporting Events Shared Private Jets
Enjoy a private jet flight at a fraction of the cost to great destinations like; New York City, Los Angeles, London and Miami or to major sporting events such as; The Super Bowl, The Masters, The UEFA Final, The Wimbledom and the Monaco Formula One while paying only for your own seat, not the whole jet.
PAY PER SEAT
Contact us for Unpublished Group Discount Rate Packages, Select Destinations.